Juniper Publishers : Sonographic Fetal Estimated Weight Significantly Differs from Neonatal Weight in the Same Population
JUNIPER PUBLISHERS- JOURNAL OF GYNECOLOGY AND WOMEN’S HEALTH
Journal of Gynecology and Women’s Health-Juniper Publishers
Authored by Gilboa Yinon*
Abstract
Background: Fetal biometric sonographic measurements are an important tool in prenatal assessment.
Objectives: To establish reliable growth charts for fetal ultrasound biometry and estimated fetal weight in a large population and to assess the difference between fetal estimated weight and actual birth weight in the same population at the same week of gestation.
Methods: Data were collected retrospectively from fetal biometric measurements performed in the ultrasound unit of the Department of Obstetrics and Gynecology at the Sheba Medical Center over a period of 9 years (n = 82,725). Data were used to calculate percentiles and nomograms for each parameter and for calculated estimated fetal weight (EFW). The 50th percentile of the calculated EFW was compared to the 50th percentile of the neonatal birth weight according to the most common Israeli growth plot charts.
Results: Reference charts were built for calculated EFW and additionally reference tables were created for biparietal diameter (BPD), head circumference (HC), abdominal circumference (AC) and femur length (FL) for singleton fetuses in the Israeli population. The estimated median weight per gestational week was significantly larger in our curves compared to the most commonly used Israeli growth plot chart (P<0.0001). The mean absolute difference was 230.6±84.8 g. The mean relative difference was 14.7 ± 7.3%.
Conclusion: We demonstrated a statistically significant difference between sonographic estimated fetal weight and neonatal birth weight through all weeks of gestation, This variance is of clinical importance in prenatal counseling, since the actual fetal weight is larger than previously expected in this population.
Keywords: Fetal biometry; Estimated fetal weight (EFW); Growth charts; Ultrasound; Israeli population
Abbreviations: HC: Head Circumference; BPD: Biparietal Diameter; FL: Femur Length; AC: Abdominal Circumference
Introduction
Fetal biometric sonographic measurements are an accepted method for predicting fetal weight and for assessing potential fetal anomalies during the second and third trimesters of pregnancy [1,2]. Measurements include head circumference (HC), biparietal diameter (BPD), abdominal circumference (AC) and femur length (FL). They are performed routinely in Israel, almost invariably among both Jewish and Arab women [3].
In 2005, Dollberg & Colleagues [4] published new standards of birth weight of singletons and multiple births based on data of birth weight by gestational age of live infants born in Israel. Since then most centers in Israel have been using these growth curves as a percentile reference of the fetal calculated estimated fetal weight (EFW). Hence, EFW, a derivation of sonographic biometric measurements, is referenced to charts based on liveborn infant weight.
Importantly, fetal biometrical measurements also serve to detect fetal anomalies. Each of the four parameters measured has a discrete growth pattern, and any deviation from the expected pattern can imply a possible placental, anatomic, genetic or chromosomal anomaly. Although there are many nomograms published in the literature [5-9], most are based on small- numbered prospective cross-sectional studies. There lies a major drawback of this methodology. Since different charts are used by different physicians, the definition of abnormal measurement may vary according to the selected reference chart. It has been shown that the assessment of fetal biometry is largely dependent on the choice of reference charts [10].
During the last few years there has been growing interest in creating population-specific fetal growth charts [11-14]. Prior comparisons to global charts used routinely in clinical practice have yielded inconclusive results. In 2005 Romano et al. [15] published new Israeli fetal weight curves that were based on 857 ultrasound examinations compared to those adopted from the American population [15]. They found differences between their new curves and the American-based curves. This was especially true in cases where fetal weight was close to, or below, the 3rd percentile of the American curve in weeks 27-35, and when fetal weight was close to or above the 97th percentile of the American curve in weeks 14-22 and 25-37.
Therefore, the aim of this study was to establish reliable growth charts for fetal ultrasound biometry and to compare the calculated growth charts to the neonatal birth weight charts in order to assess whether a significant difference exist between the two.
Patients and Methods
The study data were obtained from fetal biometric measurements performed in the ultrasound unit of the Department of Obstetrics and Gynecology at Sheba Medical Center over a period of nearly 9 years, from October 2004 to March 2013. Ultrasound examinations were performed by different operators, including specialized sonographic technicians, residents and expert sonographers, and were recorded in the hospital computerized database.
Data were collected between weeks 20 and 43 of gestation. Inclusion criteria were known gestational age by last menstruation date or corrected early ultrasound dating. In order to create a representative sample of all fetus population no exclusion criteria, such as maternal disease or fetal malformations, were applied.
Fetal measurements were all made in accordance with the guidelines outlined in Ultrasonography in Obstetrics and Gynecology [16]. Biparietal diameter (BPD) was measured from the outer border of the skull to the inner border of the skull (outer-inner). Head circumference (HC) was measured at the plane of the third ventricle with the thalami in the central portion and the cavum septi pellucidi visible in the anterior portion. Abdominal circumference (AC) was measured through the transverse section of the fetal abdomen at the level of the stomach and bifurcation of the main portal vein. Femur length (FL) was measured from the greater trochanter to the lateral condyle. Estimated fetal weight (EFW) was calculated according to the model of Hadlock et al. [1], which was shown to be the most accurate in comparison with birth weights in the Israeli population [17].
Our data was compared to the study by Dolberg et al. [4] who established standardized birth weight data from 754,713 singleton.
Several different ultrasound systems were used over the years: GE LOGIQ 7 ultrasound, Voluson 730 Expert, Voluson E6 and E8 (GE Healthcare, Milwaukee, WI, USA). The study was approved by the Institutional Helsinki Review Board of the Sheba Medical Center
Statistical Methods
Crude data were first used to calculate percentiles 1, 5, 10, 25, 50, 75, 90, 95 and 99 for each parameter (AC, FL, HC, BPD and EFW). Due to limited observations before week 20 and after 41 weeks of gestation, analysis was done only within this interval.
Exploring the plots of these quintiles by day revealed that the dependence of the quintiles on day is not linear (but rather close to linear); the dependence is not smooth and has some substantial fluctuations. The extreme quintiles (1 and 99) are much less stable than the other quartiles and the median.
We compared the crude plots (not smoothed) with non- parametric (LOWESS) smoothing of raw quintiles [18], fractional polynomial quintile regression [19] and cubic polynomial quintile [20]. We revealed that both polynomial quartile regressions failed to express important features of the crude plot. Fractional polynomial failed to demonstrate the decreasing rate of growth at the end of pregnancy, and cubic regression added an artificial elevation of 95 and 99 quartiles at the beginning of the time interval. Therefore, we applied non-parametric (LOWESS) smoothing of raw quintiles to produce nomograms for each parameter. All calculations were done using STATA 12© software.
The 50th percentile of our calculated EFW was compared to the 50th percentile of the most common plot used in Israel Dollberg et al. [4] for singleton infants. The median weight per week (for weeks 22 to 41 where both methods presented the data) were compared using the paired t-test and the Wilcoxon rank test. The relative difference in each week was defined as the difference (ours-Dollberg) divided by the average weight in this week (ours+Dollberg)/2.
Results
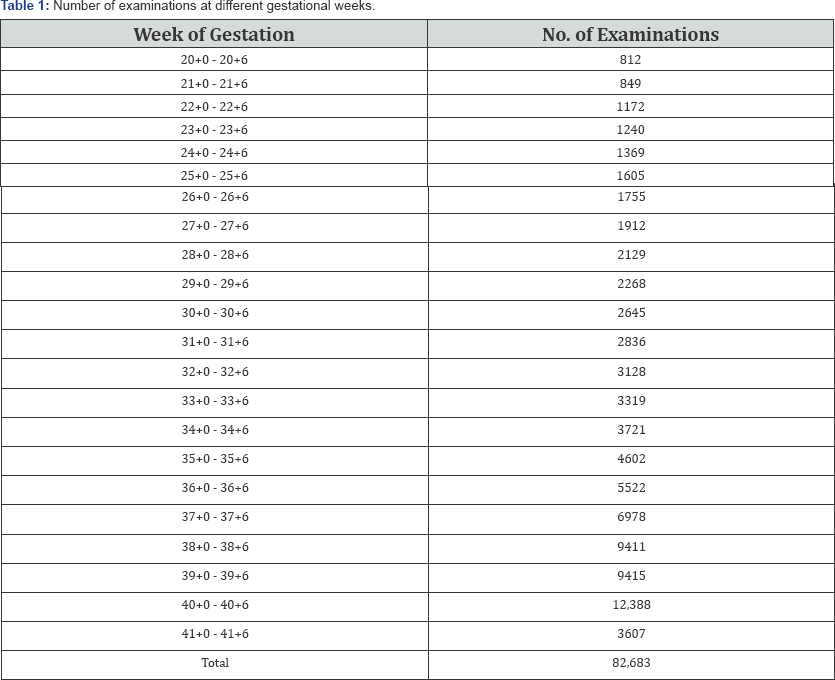
During the 9 year period, 82,725 reports of routine examinations were recorded in our institute. Of these, 82,683 were included in the analysis. Table 1 summarizes the number of observations per week of gestation. We included all reports that produced calculated EFW in the liberal range of 100 to 5000g for week 20 and 1000 to 10,000g for week 40. Examinations missing either one of the four biometrical parameters (AC, HC, FL, BPD) were also excluded. Multiple examinations of the same fetus were included at different weeks of gestation.
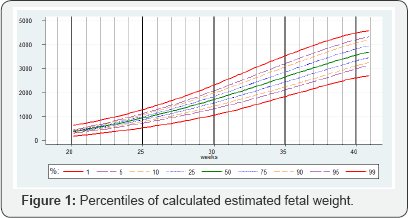
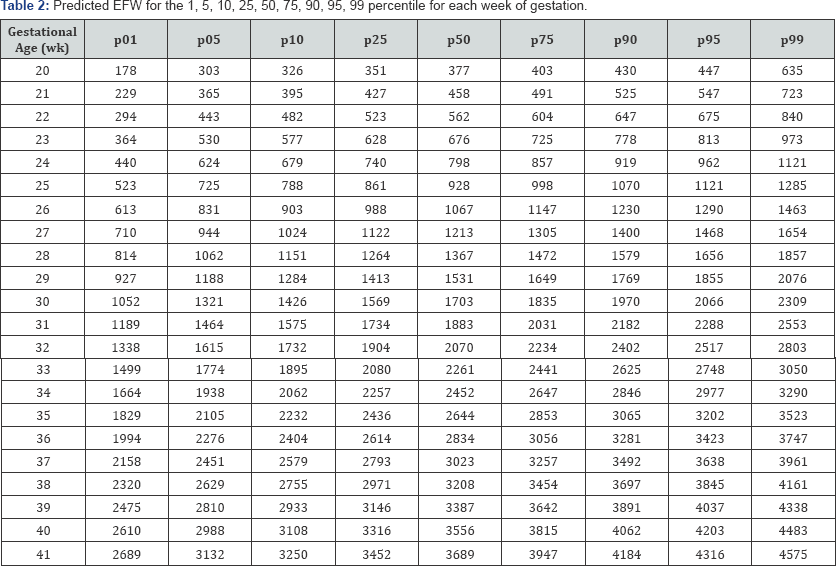
Figure 1 show the raw data for calculated EFW. Table 2 summarizes the mean and fitted centiles for calculated EFW
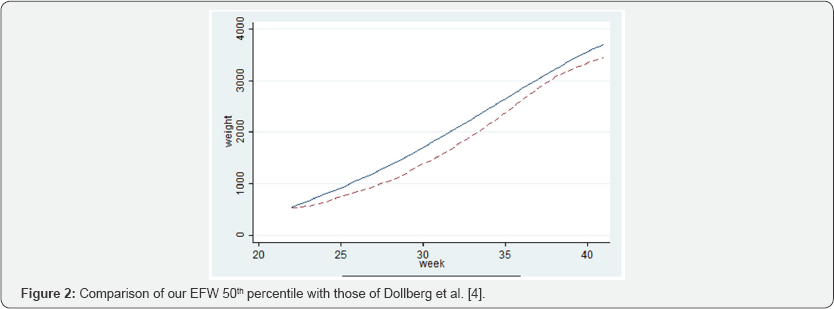
Comparison of our results of the median EFW to the Dollberg percentiles commonly used in our department is shown in Figure 2. The estimated median weight per week was larger in our curves compared to that of Dollberg et al. [4] (P<0.0001). The mean absolute difference was 230.6±84.8 g (range 32-343g). The mean relative difference was 14.7 ± 7.3% (range 4.7-25.3%).
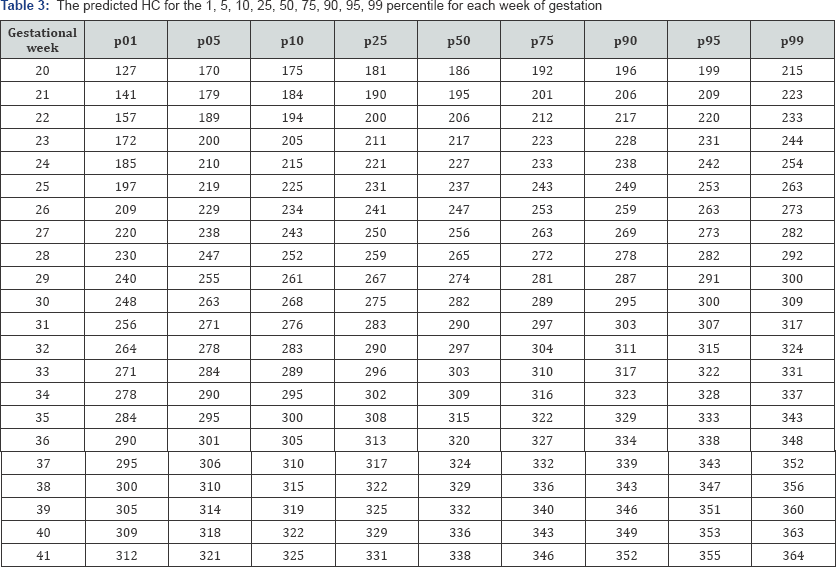
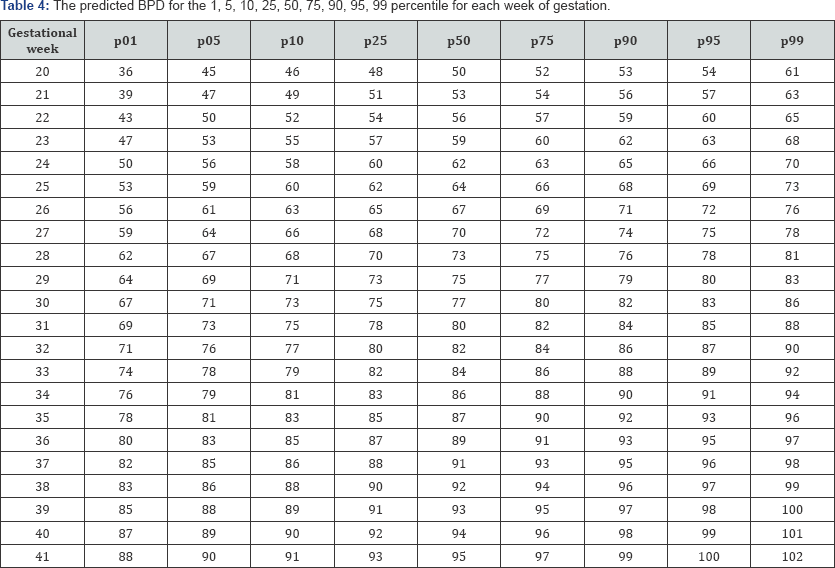
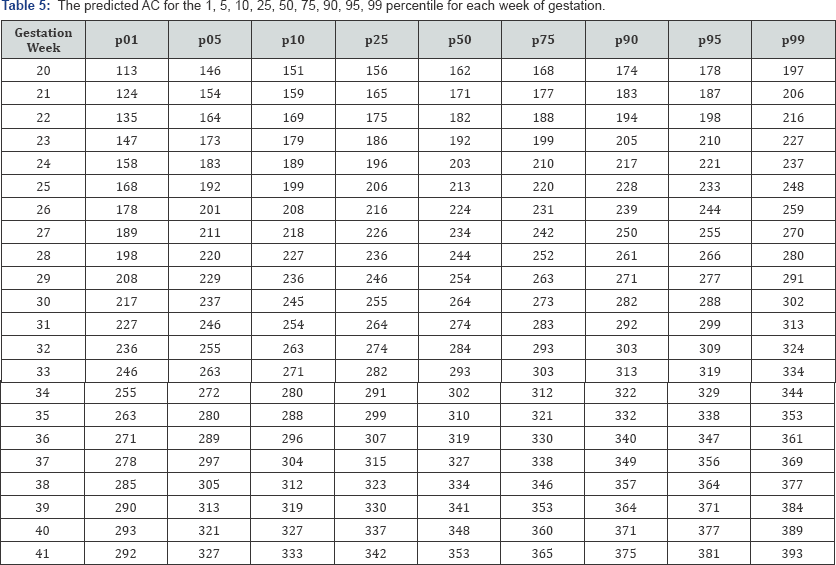
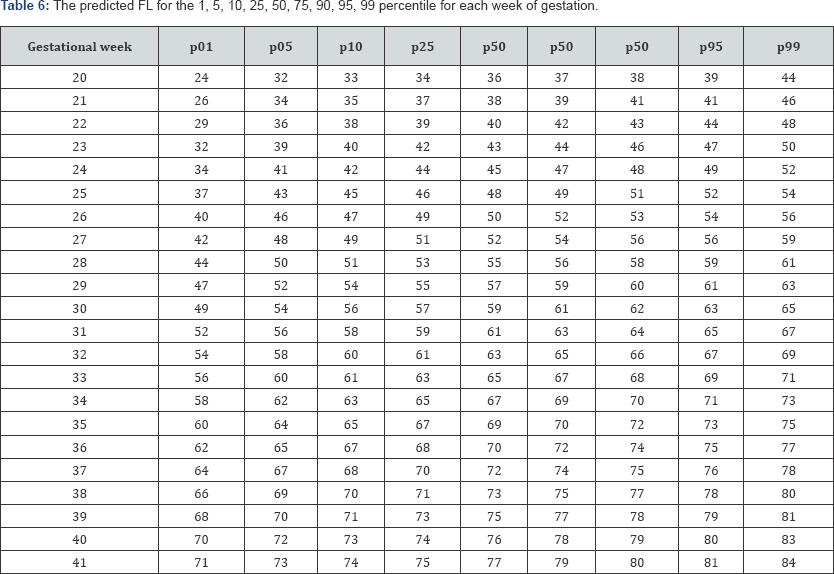
Table 3-6 show the predicted head circumference biparietal diameter, abdominal circumference and femoral length respectively for each gestational week. These were added given the importance of customized chart use in this population.
Discussion
In this study we compared new growth charts for the common fetal biometric variables in order to compare them to the actual neonatal birth weight, for the Israeli population, based on a large and minimally selected sample size. We used over 82,000 ultrasound examinations of singleton fetuses distributed from 20 to 41 weeks of pregnancy. Only examinations of fetuses with known gestational age and complete biometry were included. The data were collected by many professionals using the same methodology for fetal biometry accepted in our institute, and with numerous ultrasound devices, which is relevant for building a referral practical clinical tool. Our data include a relatively large number of examinations in the early stages of pregnancy. This enables wide data distribution, leading to better statistical analysis especially at the extreme percentiles.
The use of cross-sectional growth charts is the first-line screening tool for assessing fetal growth, and the customization of fetal growth charts improves the ability to detect high risk fetuses [10]. It has been demonstrated that in a genetically heterogeneous population, the need exists for constructing national charts of fetal biometry based on large cohorts of the local population.
The importance of tailored charts for the population studied is extremely important in prenatal consultations. For example, one of the main factors associated with differences in head growth measurement is ethnicity [21]. An Israeli study presented four women referred to a neuro-fetal clinic for isolated fetal microcephaly. Striking differences in percentiles were found between different professionals using different charts. In all children, measured head circumference after birth/termination was within normal limits [22].
Currently in customary clinical practice, most centers in Israel use either American or European charts to assess biometric parameters. These studies are based on a relatively small number of examinations and on selective populations. For example, in our institute we use the Altman and Chitty charts published in 2002 to assess femur length percentiles. These charts are based on 663 ultrasound scans and they include only western European and Afro-Caribbean racial groups [23]. Abdominal circumference and head circumference are referred to the Hadlock charts which are based on 361 fetuses and were published in 1984 [24].
When comparing our EFW chart to the commonly used Israeli infant birth weight chart created by Dollberg et al. [4]. We demonstrated a statistically significant difference through all weeks of gestation, with larger EFW observed for each week when compared to neonatal birth weight. This variance is of clinical importance in prenatal counseling, for the actual fetal weight is larger than previously expected in this population. This discrepancy may be explained by the fact that fetal birth weight is calculated by mathematic formulas and not by the actual weight at birth. Additionally, during the early half of the pregnancy it is possible that neonates delivered at that early stage were small for gestational age due to maternal disease which necessitates early delivery.
In conclusion, we constructed new Growth plot charts for fetal biometric variables suitable for the Israeli population, based on a large number of observations. The significant differences between our prenatal sonographic based growth plot charts and neonatal actual birth weight plot charts justify the use of our charts for prenatal assessment of fetal growth.
For more open access journals in JuniperPublishers please click on: https://juniperpublishers.com/
For more articles on Gynecology and Women’s Health please click on: https://juniperpublishers.com/jgwh/
To read more......Fulltext in Gynecology and Women’s Health in Juniper Publishers
https://juniperpublishers.business.site/


Comments
Post a Comment